
INTRODUCTION:
In part one of this post, I talked about understanding the various pieces of information reported by GrammaTech CodeSonar binary analysis reports. In this second part, I’m discussing the warning execution path and how to interpret the analysis reports to track down the source of the error.
The Warning Execution Path
Okay, so now we know how to read the listing, what’s actually going on with this warning? Note the shaded areas in the listing. CodeSonar operates by identifying execution paths along which some bad state can occur. The shaded areas indicate the instructions that execute along one such path. In our example, the warning report involves the execution path that starts at the entry point to the function return_append_str and sequentially works through the first eight instructions before encountering the “jz” instruction. In this case, CodeSonar considers the path in which the “jz” instruction does execute its jump. Thus the execution path continues at the label “loc_4193B8”. From there, another 9 instructions execute, including two function calls, before hitting the function call that CodeSonar thinks is problematic. Figure 1 from the previous post is included again for reference.
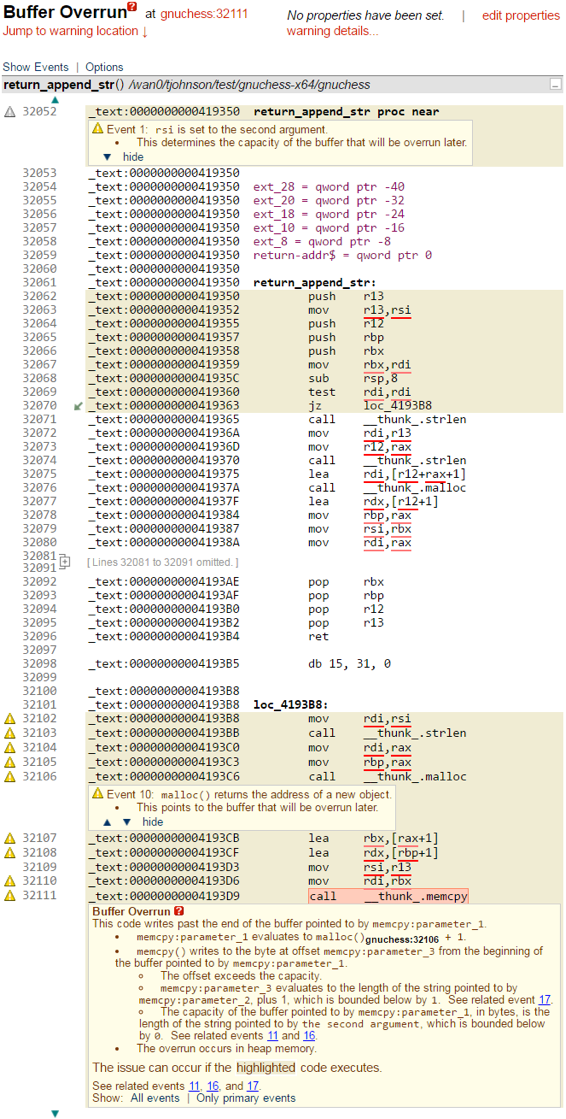
Figure 1: A Buffer Overrun Warning Generated by CodeSonar
The first of these function calls involves the two instructions:
The first copies the value of the rsi register into the rdi register. The second instruction invokes a call to the function strlen. Recall that on x64, the first two parameters to a function are passed in the registers rdi and rsi. Here the register rsi has not changed since the beginning of return_append_str, so it still has the value of the second argument. By being copied into the rdi register, this value is being passed on to the first argument of this call to strlen. Thus we can deduce that this value is a pointer to a string. Let’s call that string “s” for the moment.
Another convention for x64, is that the return value of a function call is stored in the rax register. Thus, piecing this together, we can see that the above two instructions are similar to the following statement one might see in a high-level language such as C:
rax = strlen(s);
The three following instructions setup a function call to malloc:
Again, rdi is being used as the parameter to malloc – here we’re passing the return value from the previous call to strlen to malloc. In other words, the code is allocating a new buffer on the heap whose size is the same as the number of characters in the string “s”. This should probably already raise suspicion. If this allocated buffer is going to be used to store a copy of “s”, then there is not enough space in it to store the addition ‘’ byte at the end of the string.
What about that mov instruction that copies the value of rax into the rbp register? According to the x64 calling convention on Linux, the value of rbx (and several other registers) must be retained by called functions. In contrast, since rax is used as the return value of every function call, it is almost always overwritten when calling a function. So, by copying the value in rax into rbp, the code is saving the return value from the previous call to strlen so it can use it again later.
After the call to malloc, there are two “lea” instructions:
The “lea” instruction is somewhat unique in that it does not actually perform a memory access. Rather it computes the address that the second operand would access and stores the address into the destination operand. Often the second operand isn’t actually an address of anything real; rather, the instruction is just used to perform arithmetic. Here, the first instruction is computing a memory address, but the second instruction is just performing arithmetic.
The first instruction adds 1 to the value in the rax register, which at this point has the return value of the previous call to malloc. In other words, the instruction stores in rbx the address that is one byte into the chunk of memory that the call to malloc allocated on the heap.
The second instruction adds 1 to the value in rbp. Recall, that register rbp was used to save the return value from the call to strlen earlier. Thus the instruction stores in rdx the value of 1 plus the size of the string parameter we’re calling “s.”
Finally, we have the third function call. This one targets memcpy:
The function memcpy takes three arguments. Here, we’re storing the first in register rdi, copying into it the value in rbx (the address that is 1 byte into our heap-allocated chunk of memory from malloc). The second is stored in rsi. This argument is copied from register r13. If we look back up at the beginning of the instruction trace, we see that r13 has a copy of the the address of the input string “s” (it was copied from rsi). Finally, the third parameter is in rdx, which was populated in the instruction performing the arithmetic. That is, the third parameter is the value 1 plus the size of the string “s.”
Thus, if we were to lift all three of these function calls into a higher level language, they might look like this:
To summarize, this code allocates a buffer that can only store the length of the string “s” but not the terminating ‘’ byte. Further, the copying of the string starts 1 byte into the target buffer. The result is that the call to memcpy will overwrite the allocated buffer by 2 bytes, potentially clobbering unrelated program data.
Severity of the Warning
It is often difficult to know whether or not a coding error will cause a problem. In this case, the code definitely performs a buffer overrun by 2 bytes. But is that enough to cause serious harm?
The relevant buffer here is allocated on the heap. The heap is a funny beast. It generally behaves non-deterministically. Two runs of a program that are given the same inputs may or may not experience the same heap allocations. They may make the same set of calls to malloc, but malloc may return chunks of memory in different orders or at entirely different locations. So it is difficult to be able to determine statically what exactly might be overwritten by this 2 byte overrun.
Further, heap managers often will pad allocations on the heap with extra space. This enables the heap manager to counter memory fragmentation. Depending on the size of the input string “s” and on whether or how much the heap manager decides to pad the allocation of memory that malloc returns, the 2 byte overrun may only overwrite this extra padding space and be rendered benign anyway.
Depending on the context, this particular coding flaw could be harmless, but it could also lead to crashes or data leaks. Even worse, the behaviour could change even if only small updates to non-related areas of the software are made. That depends on the system it runs on and how the heap manager operates. CodeSonar provides a warning about the possibility of a buffer overrun. It is up to the judgment of the user to decide whether or not this warning warrants a remedial response.
Further Reading
This post provides only a very short introduction to reading assembly code and understanding how software works at the binary level. There are plenty of resources on the web that provide a more in-depth treatment. Here are just a few examples:
- http://patshaughnessy.net/2016/11/26/learning-to-read-x86-assembly-language
- http://www.cs.virginia.edu/~evans/cs216/guides/x86.html
- https://www.nayuki.io/page/a-fundamental-introduction-to-x86-assembly-programming