In C/C++, if you want to use a function, variable, type, or macro that is defined in another file, you use an #include statement. The #include statement effectively tells the compiler about resources that exist elsewhere. #include statements are one of the main mechanisms C/C++ programmers use to break a system into separate modules.
Of course, we want our header files to be modular as well, so one header file will include another when the other file defines relevant types, variables, etc. And that other header file may have its own #include statements, and so on. gcc will print a text version of this include tree if you give it the -H option.
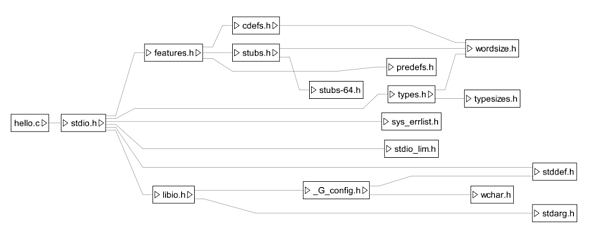
The include tree can be surprisingly large, even for modest programs. For example, the canonical ‘hello world’ C program includes just one header file: stdio.h. However, compiling ‘hello world’ on a Linux system yielded an include tree with 19 header files (the tree may vary from system to system), as shown with a simple visualization:
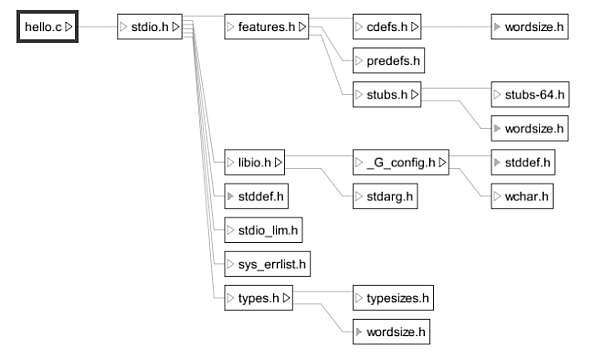
Note that some header files (e.g. “wordsize.h”) appear multiple times in the tree because they are included by different files. We can make the visualization more concise by using one node to represent all inclusions of a given file; this gives us a graph instead of a tree, with 16 header file nodes instead of 19.
Why are #include graphs important?
- #include graphs are one way to see what your code depends on. It can provide a quick view of what libraries or modules a .c/.cpp file uses.
- The #include graph also has implications for software maintenance. A change to any header file in the #include graph should trigger a rebuild of the .c/.cpp file. (Larger #include graphs suggest more frequent recompilation.) A change to a header could, in principle, break the .c/.cpp file that transitively includes it. A prudent developer will therefore re-test functionality in the .c/.cpp file when something in the #include graph changes.
- Large #include graphs make it harder to isolate a piece of code for unit testing or for use in other contexts.
- A large #include graph may slow down (or even crash) the compiler. It’s easy to forget that, technically, #include pastes the entire contents of a header file into a .c/.cpp file before it is compiled. For example, the hello world program swells from 7 lines to 839 lines once the preprocessing stage is finished. (You can do your own comparison by using the -E option in gcc.) A large #include graph gives the compiler a lot more text to parse and process, and can have a noticeable effect on compilation times.
Doxygen and cinclude2dot can generate graph files that graphviz can render as images. However, since #include graphs can get pretty big, I wanted something better suited for large datasets. CodeSonar includes a powerful visualization tool that supports a variety of layout options and can handle hundreds of thousands of nodes. CodeSonar visualizes call-graphs, but the underlying visualization technology can be used to view any sort of hierarchical graph.
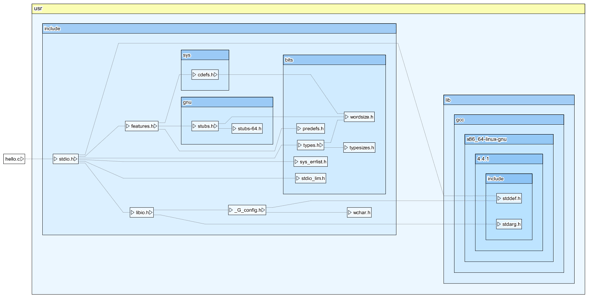
With a little hacking, I was able to feed it the output of “gcc -H” and generate the images included in this post. The graph above shows the filename for each header file in the #include graph. However, the standard headers are grouped into directories that give hints about the purpose of the header files. We can include these groupings in the visualization, giving us more information:
This shows which files live in /usr/include/bits, /usr/include/gnu, and so on.
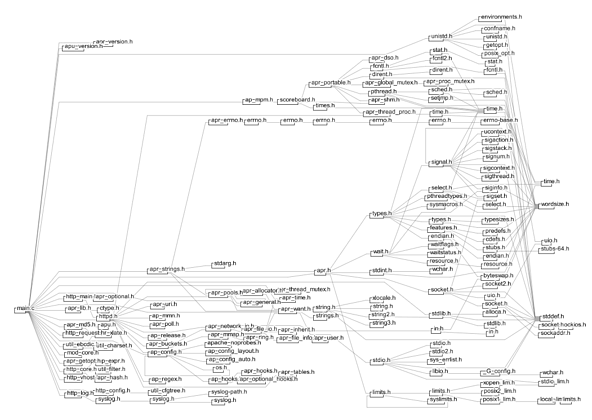
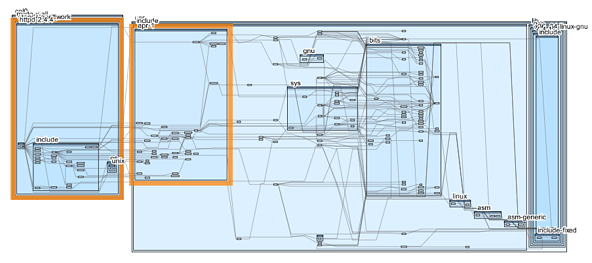
Of course, #include graphs get much larger for programs that do more than ‘hello world’. Here is the #include graph for Apache HTTPD’s main.c:
The #include graph contains 162 header files. Grouping files by directory shows more structure:
The graph is large enough that we cannot see the individual file names at this zoom level, but you can still see directory names. (The CodeSonar visualization tool is interactive, so you can zoom in and out to set the level of detail you want). You can see some of the same standard directories that appear in the “hello world” #include graph: /usr/include/bits, ../gnu and ../sys. You can also see that many headers live in the httpd and apr (Apache Portable Runtime) directories, which are highlighted in orange.
“Hello World” and Apache HTTPD are written in C, not C++. C++ programs often have larger #include graphs due to use of templates (again, see Suan Yong’s earlier post for an example of complex templates). Boost is perhaps the most template-heavy library. I compiled a small C++ program with 4 #includes, two of which are boost headers:
#include <boost/iostreams/tee.hpp>
#include <boost/iostreams/stream.hpp>
#include <fstream>
#include <iostream>
The resulting #include graph contains an impressive 602 header files. (The graph is too large to include file names in the zoomed out image.)
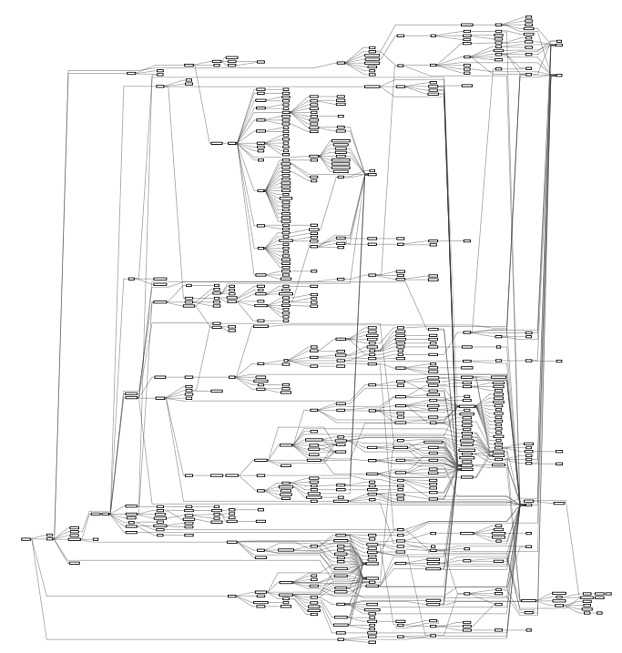
We can break this down by directory, like we did with our two previous #include graphs.
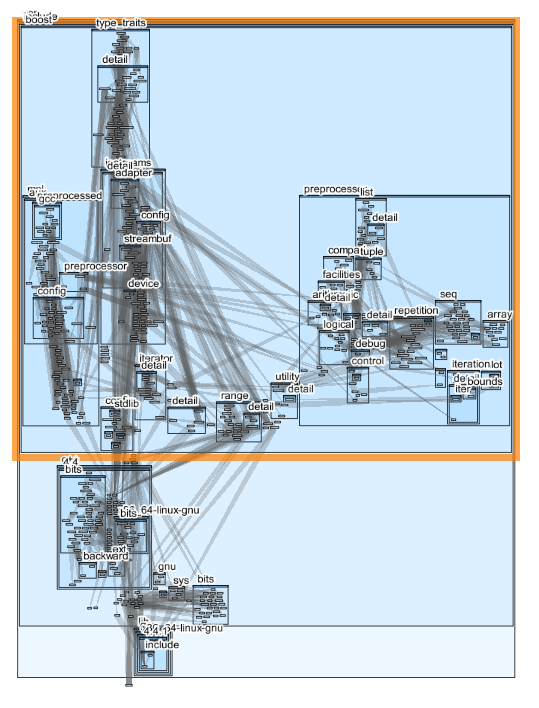
For this image, I picked a different layout algorithm (‘Cluster’ instead of ‘Flow’, for users of CodeSonar), since the large graph calls for a denser layout so you can still see directory names. The ‘boost’ directory is outlined in orange. 451 of the 602 header files are Boost header files in various Boost sub-directories, while the remaining 151 are in the standard header directories.
The Boost #include graph dramatically illustrates how a small set of #include statements may be just the tip of an iceberg-sized set of headers. It also shows that trimming unneeded #include statements may result in a large reduction of the overall #include graph.
Of course, whether an #include graph is too big depends on the context. The extra functionality delivered by a header-intensive library like Boost is often worth the downside of longer compile times. And depending on standard header files, which typically do not change dramatically, is less risky than depending on headers that change often. However, an engineer needs to be aware of the #include graph in order to make a informed judgment about whether its size is acceptable. Visualization is a great way to give engineers that awareness.
