At GrammaTech, automated tests run continuously, analyzing more than a billion lines of code a week and finding millions of vulnerabilities in that code. We wrote some of the code we analyze — CodeSonar is run on itself, for example. And we wrote micro tests aimed at warning class coverage and standards compliance. But most of our tests come from you. Open source software, mainly from SourceForge and pkgsrc, fills our test suites and keeps CodeSonar trained for the real world. So thank you!
Here’s how we use the test code and make sure the product delivers on its promises. For a given chunk of code, our testing system launches a CodeSonar analysis, gathers data and crawls the web interface. When the analysis is done, the system stores results in a database. We store a high-level description of what, if anything, went wrong, as well as attachments and values that fill in the details.
To view test results, we developed a collection of report generators that display requested data at different levels of abstraction. The most detailed report displays the result of a single test run:
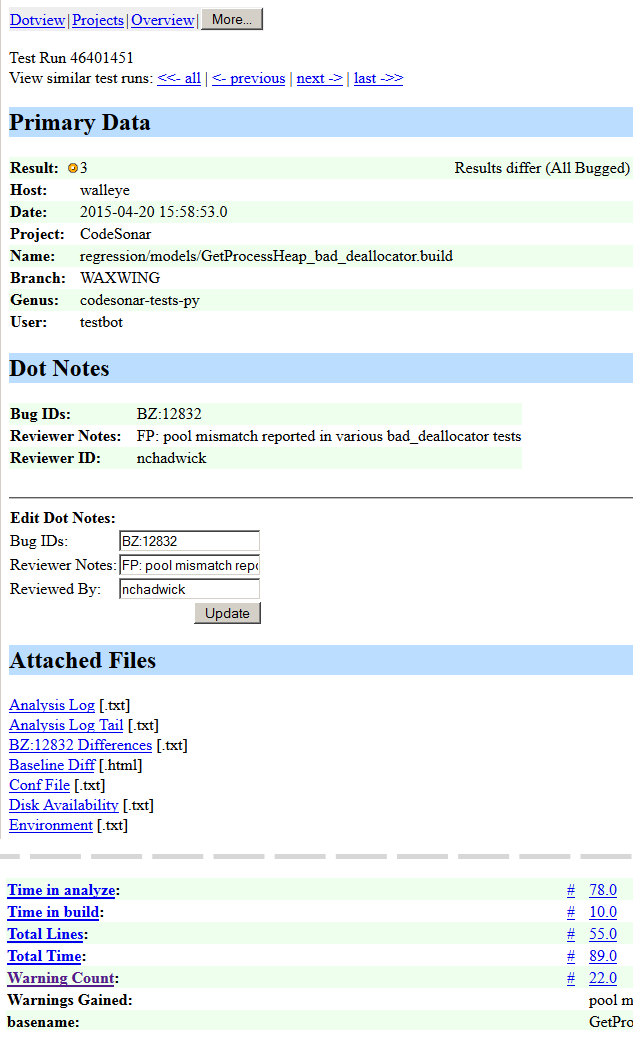
This result, for the GetProcessHeap_bad_deallocator, indicates that the test failed because the vulnerabilities CodeSonar found in the de-allocator sources didn’t match a baseline stored for the test. Maintaining baselines is challenging. Ongoing work by our developers to improve the accuracy and precision of the results may cause either the baseline or the product to be wrong.
In the sample report, note the orange dot next to the Result label. The color of the dot represents the severity of the worst problem the test system found. Green dots represent passing tests. Yellow, orange, pink, purple and red dots represent increasingly severe failures. They’re not much to look at in a single test report, but another report generator shows their worth. Our “dotview,” which tabulates dots by date and machine, quickly conveys the impact of the latest product changes:
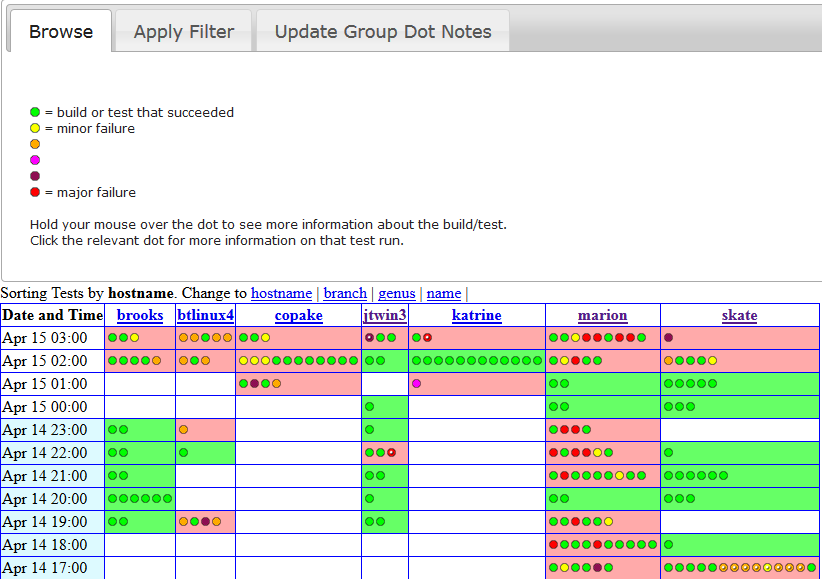
When we get to work in the morning and prepare to monitor test failures, confronting a red-splashed dotview can be intimidating, even for a single development branch. To help with that, we have filters for further restricting the view to areas of interest. In this case, we trimmed down the columns from 87 to 7 machines. For further focus, we follow the dots — each one is linked to an individual test report.
This is where the hard work begins. We examine the attachments and values of the failing test and we create, or identify, a corresponding bug in our defect tracking system. When that’s done, and we’ve interactively updated the BugID value for that test with the bug number, the report displays the dot with a white speck inside, showing our progress. Dots also have tooltips that include the top ten values from the test. This is often enough information to allow us to mark a collection of results at once and leave significantly fewer un-speck’d failures behind.
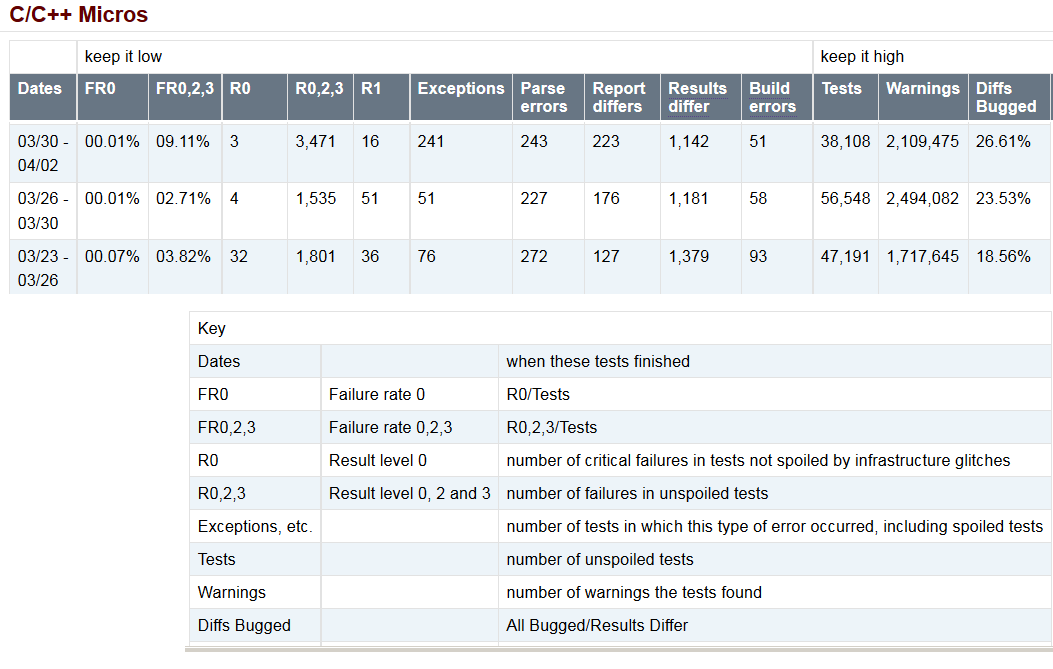
Round-the-clock testing and constant feedback is a blessing and a curse. As one engineer put it: although development tasks don’t change between when you leave at night and return in the morning, testing causes tasks to accumulate in the off-hours. To counter-act this sense of constant flow, we produce bi-weekly reports that summarize the latest results in a row of metrics and we stack them up against previous summaries. Instead of colors, this report uses numeric levels of severity (5…0 maps to green…red). We use this summary report when discussing behavior in the last few days and when looking for trends over time. In the summary report for late March, we saw a trend towards fewer crashes (R0), but more, less severe, failures.
So there you have it. We rely on reports from our database to do everything from identifying the line-of-code responsible for a crash to deciding when a deliverable is ready to ship. Polka dots help us guide and energize the development process and transform seas of red into seas of green.